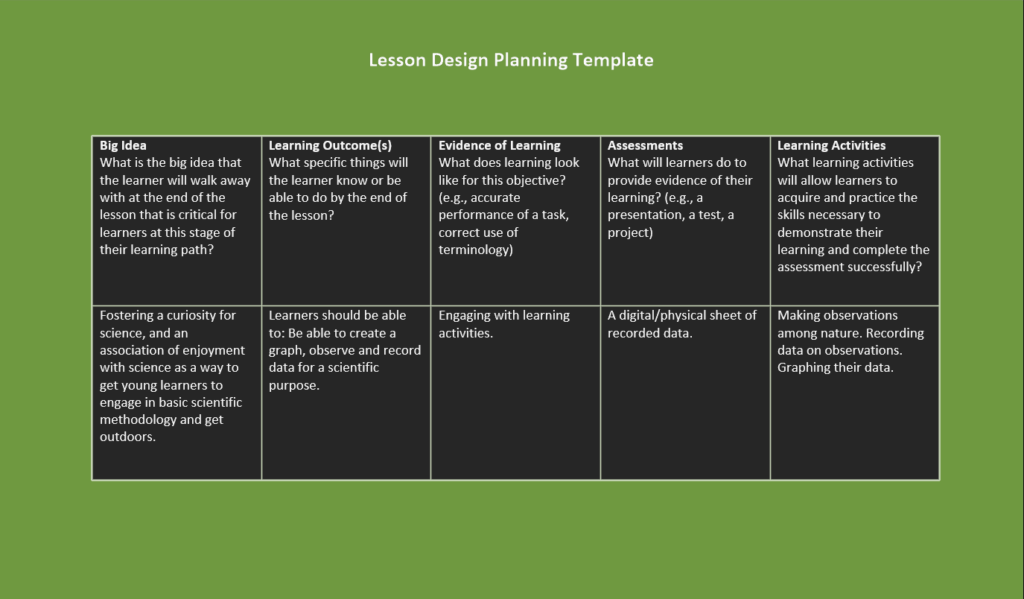
For this post I took more to our Week 6 information on instructional design as an opportunity to further develop a lesson plan I had in mind. I hope to teach this lesson design to a homeschool group that I used to take classes from when I was younger. For the purpose of this class, I want to compare it to Merrill’s 8 principles of instructional design.

Merrill’s 5 Principles emphasize learner engagement. In my lesson I want to facilitate learners being motivated and curious about the experience itself. To me, the biggest part of facilitating learning in this format is meeting the learner where they are at, with age being a big factor in that. I expect to get primarily 10-14 year old leaners, but I believe by offering proper support to learner’s experiences I could also include ages younger, and that older students will still find it engaging.
This is line with one of Merrill’s principles — demonstration. In my own learning, I have always been the most motivated and curious about the content when the instructor is there to demonstrate and support as the sort of “floor” of the lesson. I believe this is the same idea as demonstration.
I am asking learners to come up with something they would like to observe somewhere in the real world. For example the amount of a birds that you can see from a particular bench, the amount of people that come through a trail. Perhaps the frequency of different colors of cars. Anything that can be visualized with a simplistic graph. I want this to be as real-world or natural as possible, such as seeing birds fly about, so that this can be related to previous experience of observing nature (Who doesn’t as a kid?), and integrated to as much future experience as possible. I also want this to be genuinely scientific – simple, mind you, but scientific for the same reason of teaching foundational skills.
The process of data recording and graph creation serves two purposes — 1. Familiarity with the basics of graphs as a learning outcome (I love graphs!), and 2. Adding a purpose for their observations. The data and graphing allows learners to apply this experience to something they are creating. I think this lesson plan is ultimately in line with Merrill’s principles.